
Selecting Data
Contents
Selecting Data
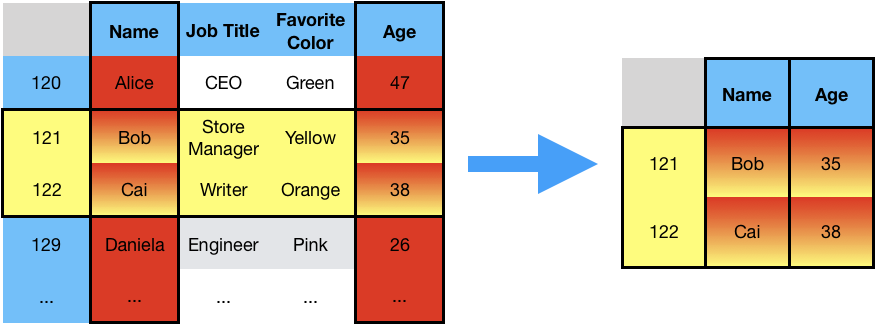
A given table usually represents a set of measurements for a given population. Oftentimes, one’s interest lies in either a specific subpopulation of interest (i.e. rows) or a specific subset of measurements (i.e. columns).
For example, in the table below, one might want to
restrict attention to those individuals in their thirties,
concern oneself with the name and age of the individuals.
Selecting rows and columns based on this criteria results in a smaller table:
The previous chapter covered selection of single rows and columns, using .loc[] and [] respectively. This section covers general approaches to selecting a subtables of a given table. These approaches include:
selecting explicit subsets of observations (rows) and/or attributes (columns),
selecting subsets of observations and attributes based on conditions using boolean arrays.
Selecting explicit subsets of rows and columns
Row selection
The dataframe currencies contains different currency names, their exchange rate against the US Dollar, and the continent of the given country, indexed by the name of the country manufacturing the currency.
currencies = pd.DataFrame({
    'currency': ['usd', 'yen', 'euro', 'peso', 'renminbi'],
    'exchange': [1, 105.94, 0.897, 19.64, 7.02],
    'continent': ['North America', 'Asia', 'Europe', 'North America', 'Asia']
}, index=['USA', 'JPN', 'EU', 'MEX', 'CHN'])

currencies
| currency | exchange | continent | |
|---|---|---|---|
| USA | usd | 1.000 | North America |
| JPN | yen | 105.940 | Asia |
| EU | euro | 0.897 | Europe |
| MEX | peso | 19.640 | North America |
| CHN | renminbi | 7.020 | Asia |
Recall that currencies.loc['MEX'] selects the attributes corresponding to MEX; this row is a one dimensional Series object.
currencies.loc['MEX']
currency              peso
exchange             19.64
continent    North America
Name: MEX, dtype: object
Selecting a subset of rows results in a potentially smaller table. However, such a table is still a two dimensional dataframe. To select a subset rows, simply pass a list to loc. For example, to create a table from currencies consisting of the rows indexed by JAPAN and CHN:
currencies.loc[['JPN', 'CHN']]
| currency | exchange | continent | |
|---|---|---|---|
| JPN | yen | 105.94 | Asia |
| CHN | renminbi | 7.02 | Asia |
Selecting explicit subsets of rows using loc: Given a dataframe df and a subset idx_list of the index df.index, the dataframe df.loc[idx_list] consists of the rows of df with index given by idx_list.
Example: If the index list consists of one a single index, the resulting object is still a two dimensional dataframe, consisting of a single row.
idx_list = ['USA']
currencies.loc[idx_list]
| currency | exchange | continent | |
|---|---|---|---|
| USA | usd | 1.0 | North America |
Column Selection
Recall that currencies['exchange'] selects exchange rate column for each country in the table; this column is a one dimensional object.
currencies['exchange']
USA      1.000
JPN    105.940
EU       0.897
MEX     19.640
CHN      7.020
Name: exchange, dtype: float64
Similar to row selection, passing a list of column names produces a dataframe with the columns given in the list. For example, to select only the ‘currency’ and ‘exchange’ columns:
currencies[['currency', 'exchange']]
| currency | exchange | |
|---|---|---|
| USA | usd | 1.000 |
| JPN | yen | 105.940 |
| EU | euro | 0.897 |
| MEX | peso | 19.640 |
| CHN | renminbi | 7.020 |
Selecting explicit subsets of columns using []: Given a dataframe df and a subset cols of the columns df.columns, the dataframe df[cols] consists of the rows of df with columns given by the columns in cols.
Example: This method of column selection offers a convenient way of explicitly reordering the columns of a table: pass the full column list in the desired order.
cols = ['continent', 'currency', 'exchange']
currencies[cols]
| continent | currency | exchange | |
|---|---|---|---|
| USA | North America | usd | 1.000 |
| JPN | Asia | yen | 105.940 |
| EU | Europe | euro | 0.897 |
| MEX | North America | peso | 19.640 |
| CHN | Asia | renminbi | 7.020 |
Selection of subtables via conditions
Most often, selection of observations and attributes occur via applying some relevant criteria. For example, in a table of survey responses, one may only want to consider:
responses from respondents of a certain age (row selection)
answers to questions that have a 100% response rate (column selection).
Such selections occur in two steps:
create a boolean index using a vector comparison that captures the selection logic,
pass the boolean index to the Pandas row/column selector.
Boolean indexing
Boolean indexes are boolean arrays that represent whether or not a condition is met for a given position in an index. Such arrays are created using logical operators on array objects. For example, a boolean index for those countries whose exchange rate is create than one is given by:
currencies['exchange'] > 1
USA    False
JPN     True
EU     False
MEX     True
CHN     True
Name: exchange, dtype: bool
A boolean index that reads True if a country is either in Asia, or has an exchange rate less than 1, is given by:
(currencies['continent'] == 'Asia') | (currencies['exchange'] < 1)
USA    False
JPN     True
EU      True
MEX    False
CHN     True
dtype: bool
Selecting rows using boolean indexes
Rows of a Pandas dataframe can be selected by passing a boolean index to loc. For example, one can create a dataframe consisting of the rows containing JPN and MEX using a boolean array with True only in the second and fourth positions:
bool_arr = [False, True, False, True, False]
currencies.loc[bool_arr]
| currency | exchange | continent | |
|---|---|---|---|
| JPN | yen | 105.94 | Asia |
| MEX | peso | 19.64 | North America |
The subtable consisting of countries either in Asia or with an exchange rate less than 1 is obtained via:
asia_or_exch_less_1 = (currencies['continent'] == 'Asia') | (currencies['exchange'] < 1)
currencies.loc[asia_or_exch_less_1]
| currency | exchange | continent | |
|---|---|---|---|
| JPN | yen | 105.940 | Asia |
| EU | euro | 0.897 | Europe |
| CHN | renminbi | 7.020 | Asia |
Selecting rows using boolean indexes: Suppose df is a dataframe and bool_arr is a boolean array of the same length of df. Then df.loc[bool_arr] is a dataframe whose rows are the rows of df for which the corresponding position in bool_arr is True.
Selecting rows using functions
Rows of a Pandas DataFrame can also be selected by passing a function to loc:
the function takes in a DataFrame and returns a boolean array;
this boolean array (applied to the DataFrame at hand) is then passed to loc to select the rows as outlined above.
Example: To select the rows in currencies whose currency begins with the letter ‘o’:
def ends_in_o(df):
    '''returns a boolean array representing
    whether each row in the currency
    column of `df` ends in  the letter o.'''
    return df['currency'].str.endswith('o')

currencies.loc[ends_in_o]
| currency | exchange | continent | |
|---|---|---|---|
| EU | euro | 0.897 | Europe |
| MEX | peso | 19.640 | North America |
selecting rows using function: Suppose df is a DataFrame and f is a function that takes in a DataFrame and returns a boolean array. Then df.loc[f] returns the same DataFrame as df.loc[f(df)].
This technique is useful when using method chaining, as the function generalizes the selection logic without referencing a specific DataFrame.
Example: Without using sort_values/drop_duplicates, and using method-chaining, return a DataFrame containing the country (or countries) with the largest exchange rate among the currencies that end with the letter ‘o’.
This requires two steps:
select the countries whose currency begins with the letter ‘o’,
select the countries in the DataFrame from step 1 whose exchange rate is the largest.
def equal_to_max(df):
    '''returns a boolean array denoting if the exchange
    rate of a row of `df` is equal to the max exchange rate.'''
    return df['currency'] == df['currency'].max()
(
    currencies
    .loc[ends_in_o]
    .loc[equal_to_max]
)
| currency | exchange | continent | |
|---|---|---|---|
| MEX | peso | 19.64 | North America |
Remark: This cannot be done by passing a boolean index directly, as the logic in step 2 refers to the output of step 1, which doesn’t have a name! While this example is contrived, this constraint commonly appears when adding and modifying columns of a DataFrame using method chaining.
Selecting subtables using loc
The loc selector allows simultaneous selection of rows and columns via matrix notation. That is, given a dataframe df, a list of indexes idx, and column labels cols, the expression df.loc[idx, cols] evaluates to the dataframe with rows corresponding to the index idx and columns corresponding to the columns in cols.
For example, the currency and exchange rate for MEX and JPN is given by:
countries = ['MEX', 'JPN']
attributes = ['currency', 'exchange']
currencies.loc[countries, attributes]
| currency | exchange | |
|---|---|---|
| MEX | peso | 19.64 |
| JPN | yen | 105.94 |
Similarly loc can also take pairs of boolean arrays corresponding rows and columns. Below selects the first and last row and the middle column using boolean arrays:
currencies.loc[
    [True, False, False, False, True],
    [False, True, False]
]
| exchange | |
|---|---|
| USA | 1.00 |
| CHN | 7.02 |
The slicing operator : selects all rows and/or columns when passed into loc:
currencies.loc[:, attributes]
| currency | exchange | |
|---|---|---|
| USA | usd | 1.000 |
| JPN | yen | 105.940 |
| EU | euro | 0.897 |
| MEX | peso | 19.640 |
| CHN | renminbi | 7.020 |
Beware: strange behaviors with row and column selection
What if your boolean arrays have incorrect length?
What if your indexes/columns are of boolean type?
[]has the same problems!Duplicate column names / duplicate selection?